LIMITED TIME OFFER - 10% off our service! Use promo code "IE10OFF" to save up to $200. Learn more or contact us here.
For a while now, I’ve been operating on the theory that most of the inflation being pushed through the markets was a “lag” from the early warning signs we saw in commodity price around this time last year.
Basically, all the inputs went up at the same time, and the consumer prices took time to “feel that”.
I also think that the volatility surrounding rates peaked during the summer with the June CPI crash:
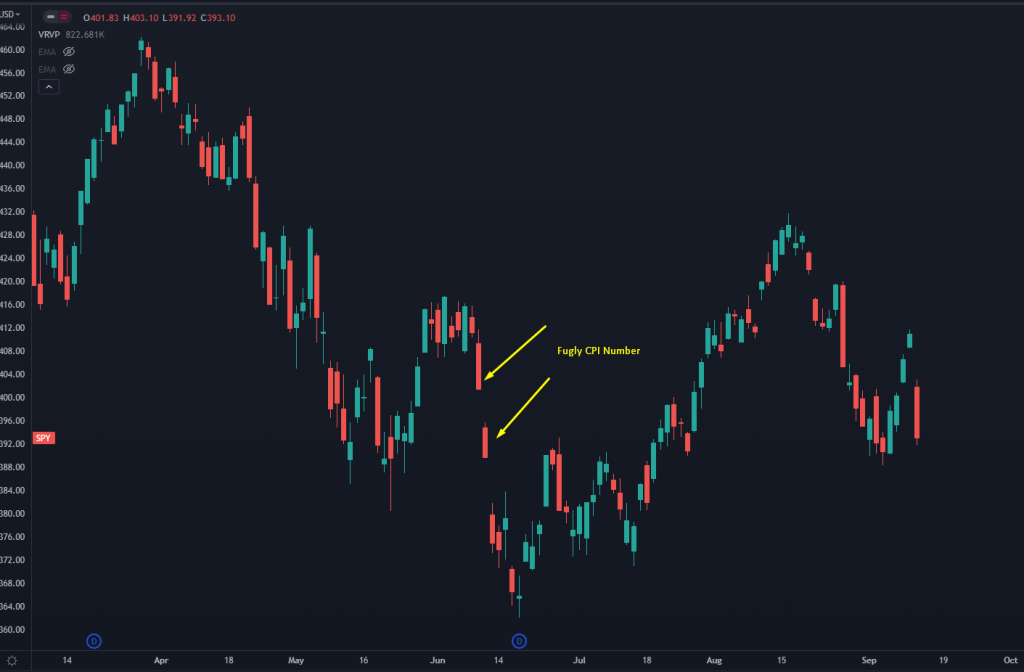
Now we come through today, with an ugly CPI print. Markets expected 8% and the print came in at 8.3%.
That means the “nose over” that many were expecting into the fall simply hasn’t materialized.
In response to that, the interest rate markets are having another adjustment.
Here’s a look at how Fed Fund Futures are trading in December:
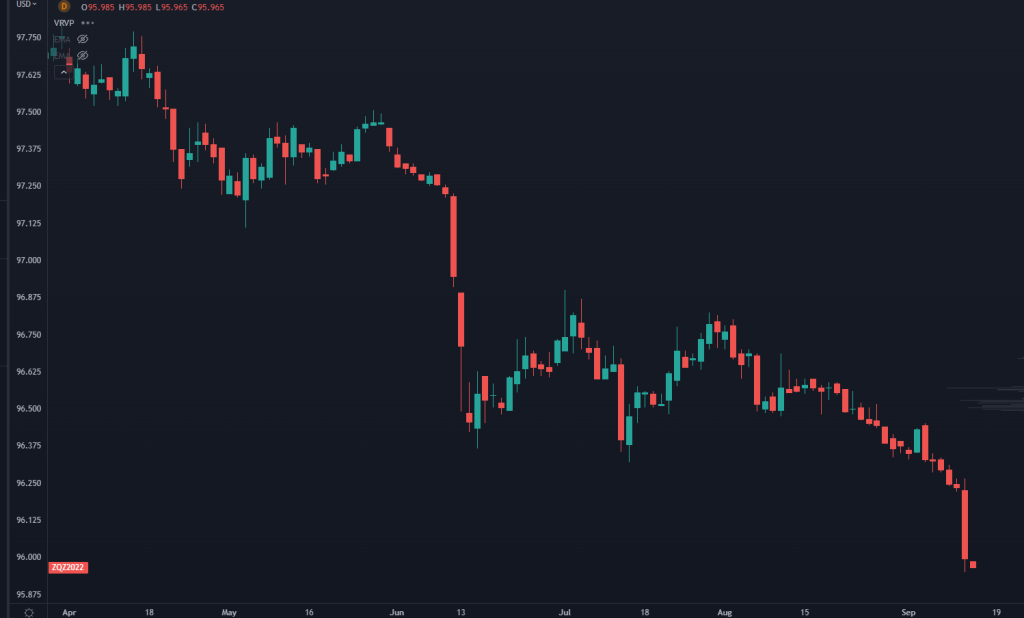
What this means is that the markets are now pricing in a much more aggressive Fed hike next week.
Instead of 50 basis points, we’re getting 75.
It’s very possible that this is a “sell the rumor, buy the news” kind of thing.
We’ll probably get another shakeout, but after the Fed rate decision, the need to sell and hedge has already passed.
We’ve seen this mechanic play out in the past– the June lows are a notable example.
Still… this is where things can get weird.
Let me provide two examples.
The first is the Fiscal Cliff from 2011:
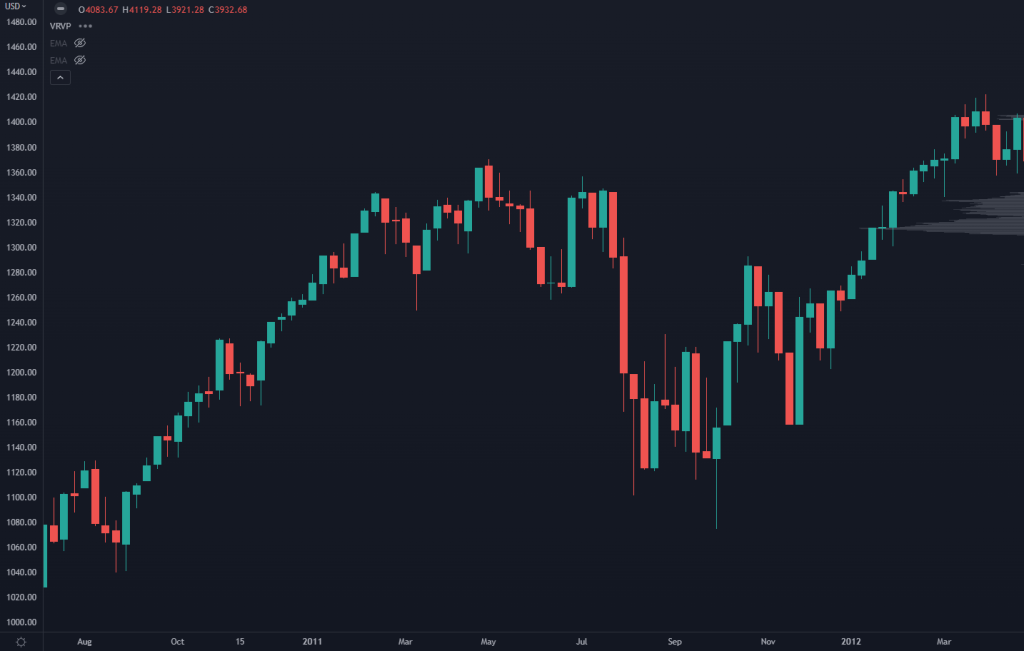
There was a nasty move lower on the S&P downgrade of US debt, and the market tried to break down under 1100…
But, most of the risks were known and contained, so there was no downside followthrough.
Let’s take the another example, this time in late 2018:
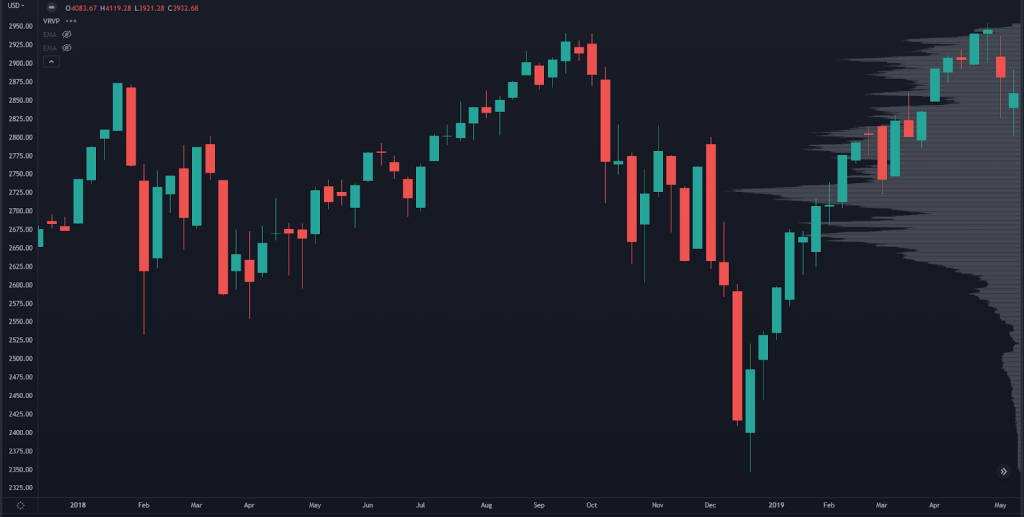
The market had traded in a very volatile range from October to early December, and then completely fell out of bed.
I remember that market, and we were all at our trading desks on Christmas Eve trying to figure out what the heck was going on.
And it wasn’t until we started to see serious risks in the debt markets that the Fed finally cried uncle and started their “pivot”.
So here we sit, with the expectation that the Fed window will be 4.25%-4.50% by February of next year.
There are companies… heck there are ENTIRE business models that fall apart if rates hit this leve.
The last time we had a window over 4% was in 2006, and the credit crisis got weird after that.
If that were to happen, I don’t think we would have the same kind of lag effects like in 2008, because housing drove that market and is very illiquid.
Instead we have very real risks in Europe and China that can get much more quickly priced in.
And this is why we want to start watching the credit markets.
JNK is the easiest to watch, this shows how the junk bond market is trading:
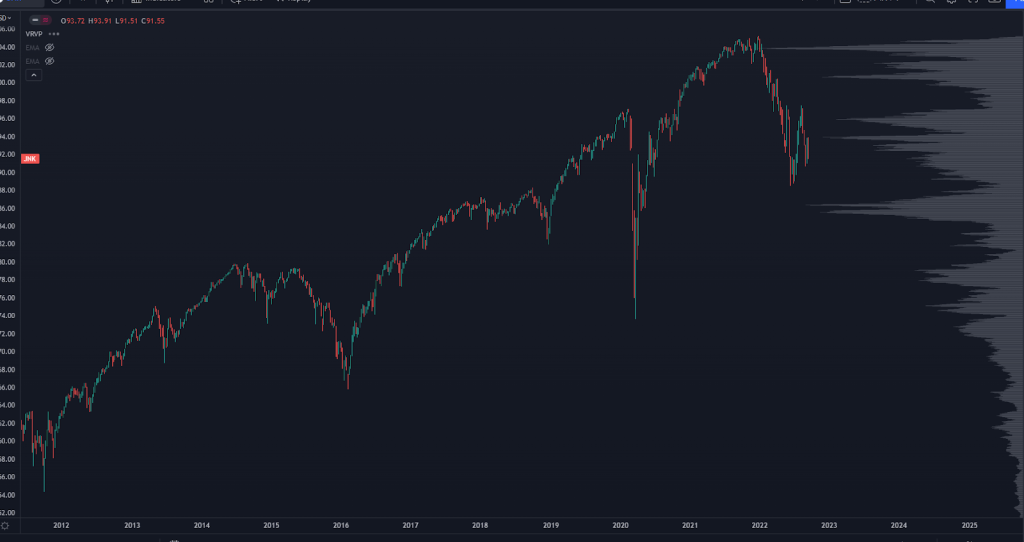
If this rolls over hard, it could mean another leg down in broad indices.
Much of the risk in this market lies in large cap equities.
The generals are the last to get shot, and so you don’t have much of a cushion to work with.
But… we do have names in the “value” space that are now trading at a very attractive price that have already seen most of their downside…
These names were the first into the bear market and they’re the first out.
If you want to see how we find “deep value” even as we enter the “everything bubble”...