LIMITED TIME OFFER - 10% off our service! Use promo code "IE10OFF" to save up to $200. Learn more or contact us here.
The market “vibe” has felt a little different over the past few trading sessions.
Things are still moving hot, but we’ve started to see normalization under the surface.
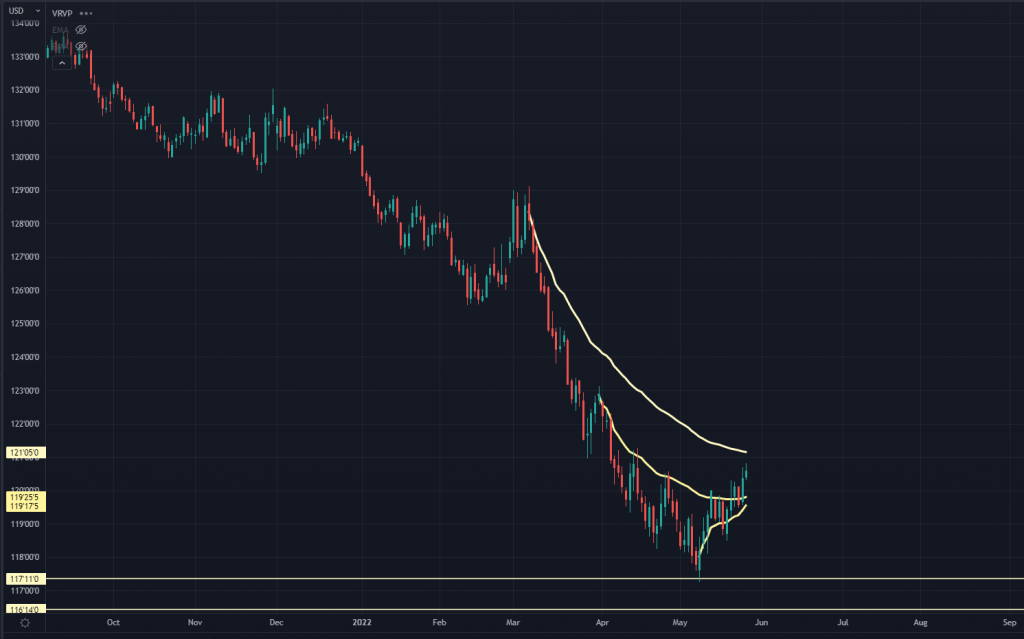
First, the bond market’s no longer in a massive rout. Here’s a look at 10-year treasury futures:
We’ve also seen some signs of a “pause” in the inflation data.
One spot we’ve been watching is the 5-year breakevens, and we’ve also discussed how insiders are starting to call “BS” on the diesel input squeeze.
Intraday, when I watch this tape, it’s feeling a little calmer.
It’s not about whether the market can sell off…
But whether the liquidity improvements so the S&P futures market isn’t skipping around like a low-float penny stock.
Remember: Price leads narrative.
By the time we get the “all-clear” that things look better from a monetary perspective, we’ll have already seen a huge market move.
This is why we watch the insiders. They give us the earliest clues a stock is ready to turn around.
If you catch them right as the stock has an upswing, it could lead to HUGE profits.
However, it can be tough to go through each company individually to track the insider buys and sells.
That’s why we use an indicator called the buy/sell ratio for the market…
But I want to take this ratio one step further by breaking it out into individual sectors.
For example, I’m seeing a very interesting play in Real Estate:
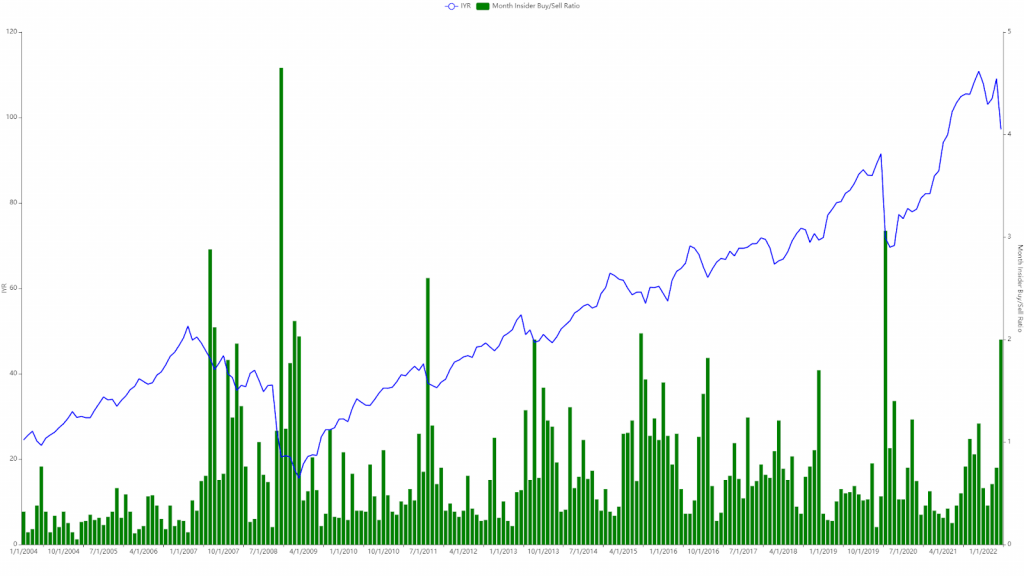
This is the first uptick in insider buying activity we’ve seen in this space since the March 2020 lows. These participants were not expecting the 2008 credit crisis, but we didn’t have the same kind of macro backdrop back then.
Put this buying activity at the backdrop of what is happening in the markets right now.
Treasuries just had their worst selloff in 20+ years, and the Fed Funds Futures market is pricing in 3% by November...
That would put the 30-year fixed between 6-7%.
When you see insiders buying into that — especially in the Real Estate market — they’re telling us that they still have a viable business model.
After all, they can always hike rents during an inflationary period, and many of the assets were financed at much lower rates earlier.
I would start looking in this area, along with regional banks and other lenders.
That’s what we’ll be doing at Insiders Exposed — and for a limited time this Memorial Day weekend, you can join us at a steep $500 discount.
To take advantage, watch this free insider trading presentation.
Toward the middle, I’ll explain how you can get in today and claim your $500 discount.