LIMITED TIME OFFER - 10% off our service! Use promo code "IE10OFF" to save up to $200. Learn more or contact us here.
A quick way to see if a sector is mounting a turnaround is to compare it to the price of the broad market.
For example… here’s a look at ARKK (to represent tech growth stocks that don’t turn a profit) vs. QQQ (to represent crowded mega-cap names).
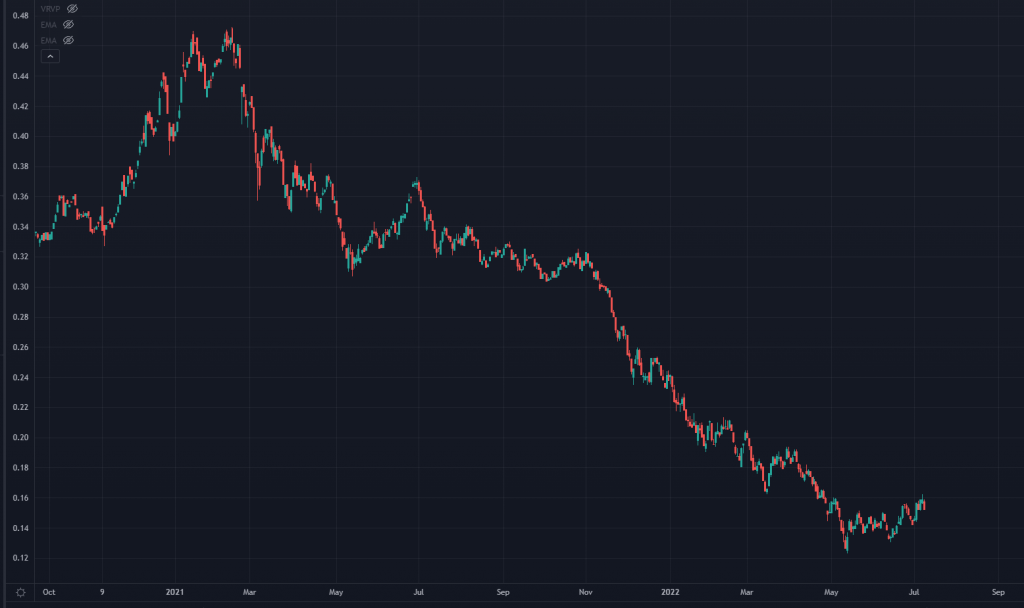
Full hindsight of course, but demand for high-risk stocks peaked in February 2022…
About 10 months before the rest of the markets got clobbered.
If you zoom in, you can see that a very subtle shift in this relationship has happened:
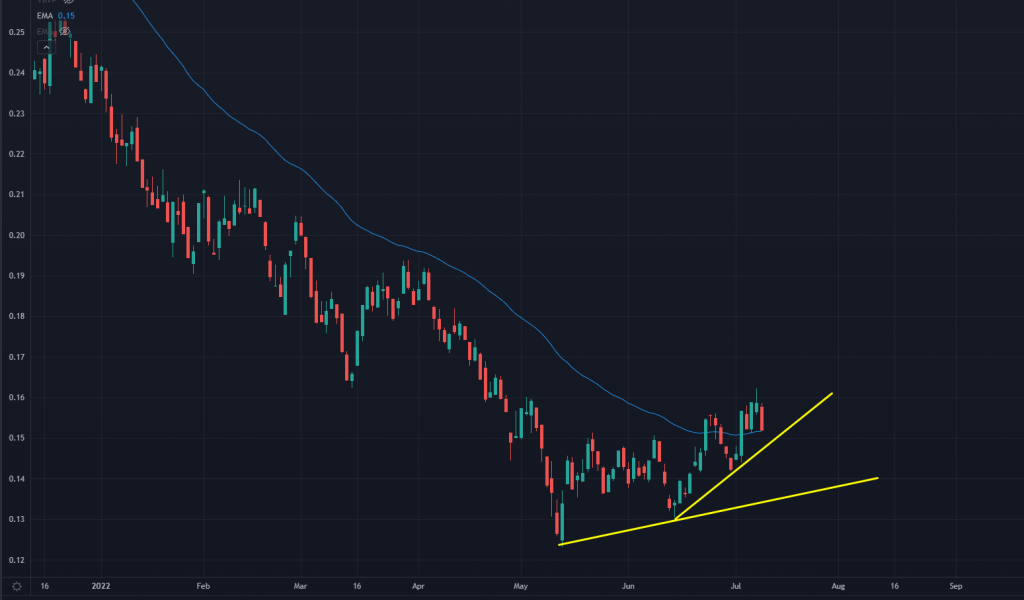
Since May, some ARKK names have outperformed to mega-cap tech.
This isn’t a guaranteed turnaround yet, but it’s worth considering that high-growth tech has finished deleveraging for the rest of the year.
Let’s take a look at another one — this time XBI (biotech) to SPY (S&P 500):
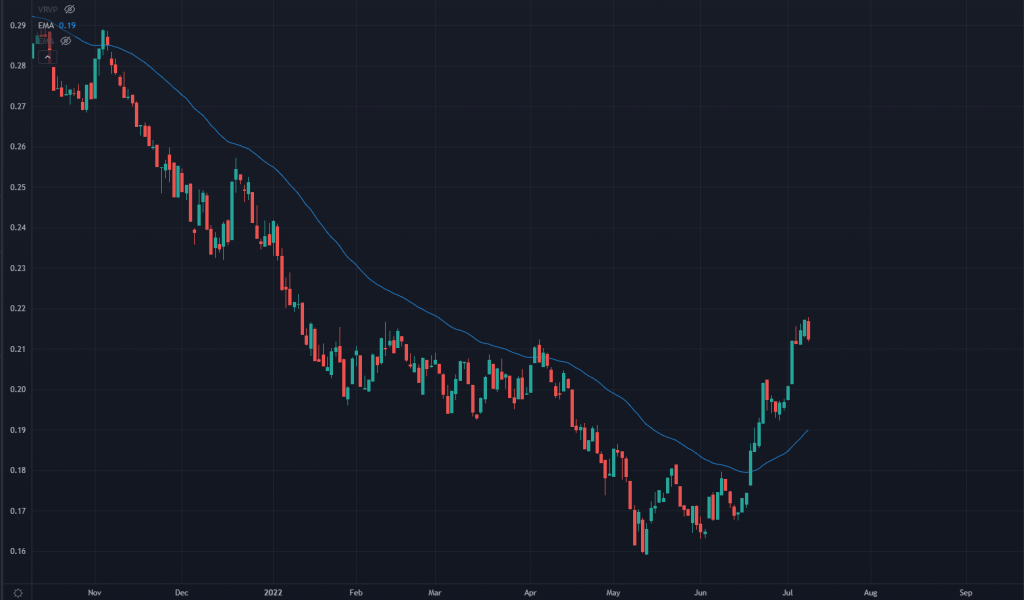
Back in May, there was no reason to think this relationship would change.
But for about a month, biotech has been on an absolute tear.
Was there a way to get ahead of this?
Check out this chart:
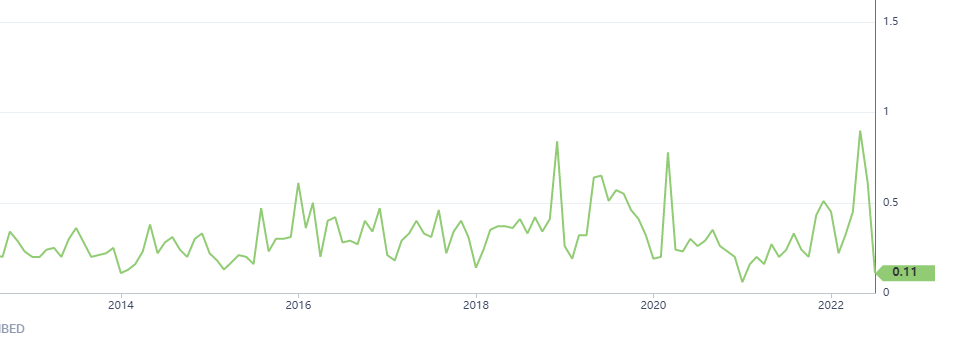
This shows us the insider buy/sell ratio for the healthcare industry.
See those three spikes higher?
They all correlated with major market bottoms in this sector, and we just saw one hit.
Go here to see how this ratio works in more detail… and how to use it to your advantage.