LIMITED TIME OFFER - 10% off our service! Use promo code "IE10OFF" to save up to $200. Learn more or contact us here.
The massive commodity price spikes are now front and center in the financial media…
And the energy spike, in particular, is starting to seriously concern consumers.
(This is a great psychology lesson in anchoring on whole numbers, by the way. Most people in the US didn't freak out until gas broke $4 a gallon in most places.)
Now, we spent a good part of last year talking about the risks with rising commodity prices here and here.
One big question on the minds of most traders is:
Will it stick?
Because we've seen several times where a commodity spiked higher, then saw a hard reversion afterward.
Lumber futures offers a good example. It's not that we ran out of lumber…
It's that we had a period where we had a supply chain shortage in lumber processing:
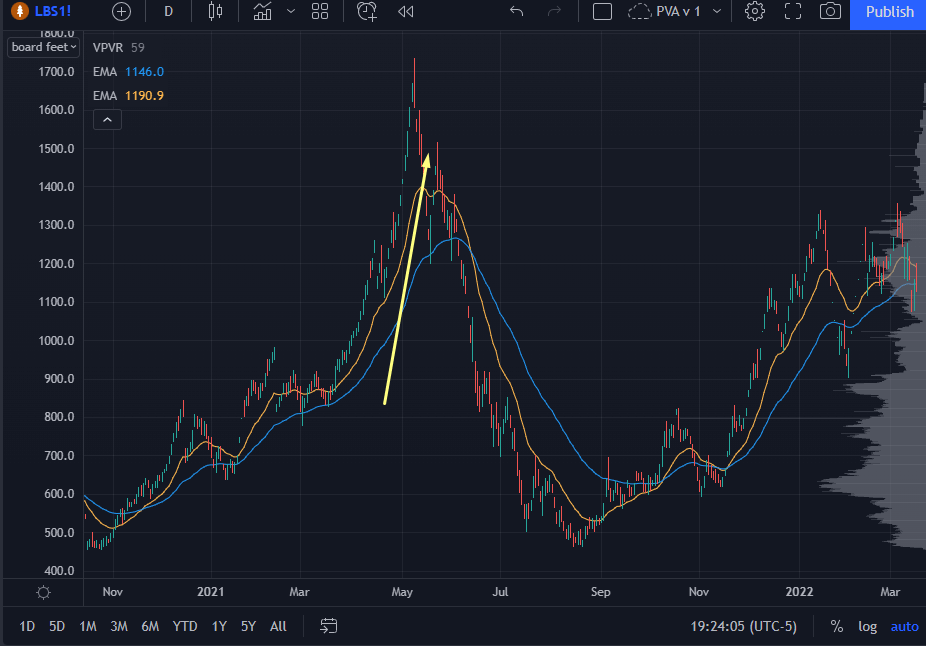
Lumber futures chart
Lumber futures ran from 800 to 1700.
What a move!
Once they turned on more lumber processing, supply drastically increased, and the market had a hard selloff.
Could this happen in, say, the oil markets?
Well, we have the war in Europe, and it seems this could never end:
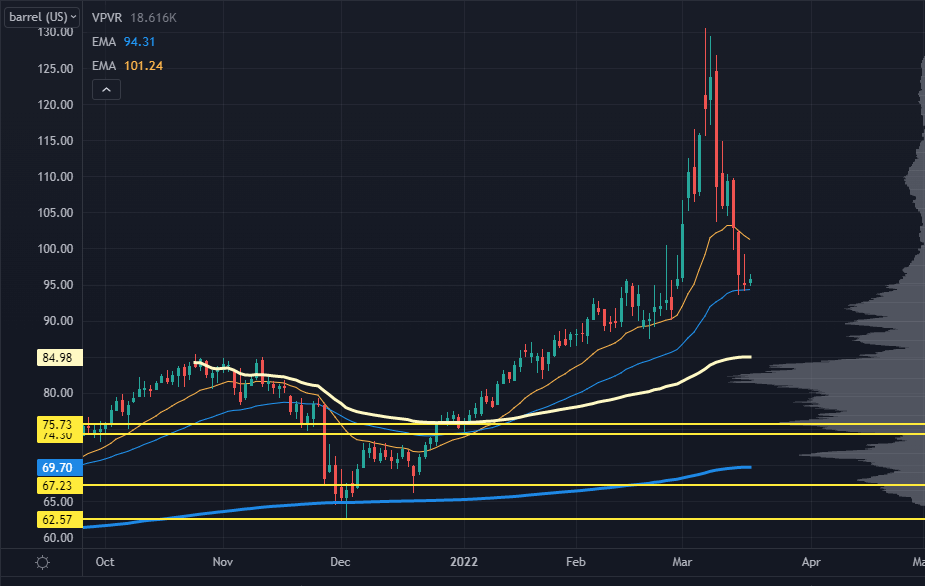
Barrel price chart
Yet we've already had a hard move off the highs...
And I can tell you that the futures market isn't exactly expecting a further spike in the near term.
What kind of magical crystal ball do I have that tells me this?
The market, of course.
One simple way to do this is to measure the difference between front-month (the closest month to a futures contract’s expiration) and next-month futures.
The math is quite simple — if next month's futures contract has a similar value to the front month future, commercial participants are willing to pay that high price further out in time.
In other words, the market expects it to stick.
We can view the difference between front-month and next-month inside of TradingView:
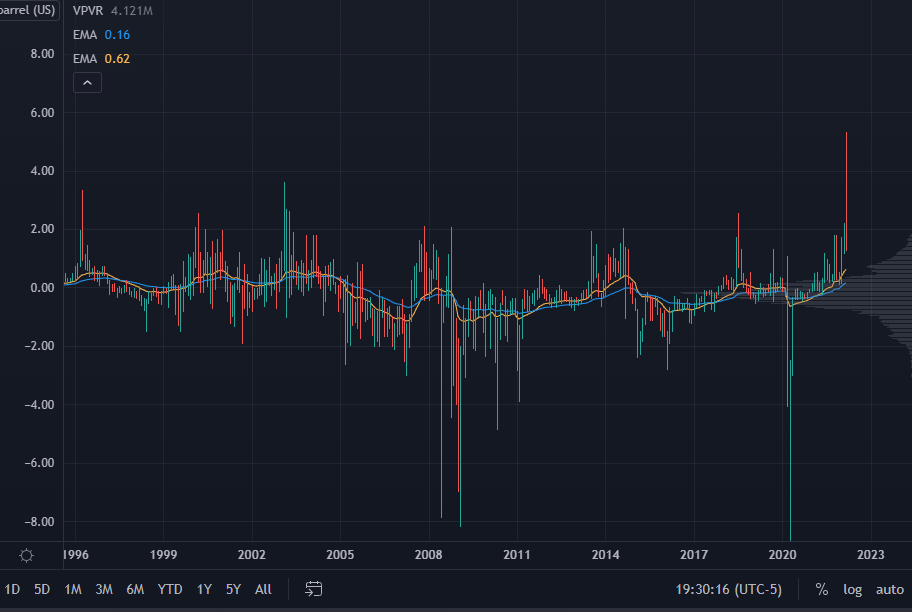
Barrel Price Chart Monthly
This monthly chart goes back to the late 90s.
Remember the start of the oil spike in 2005? I sure do.
After Katrina hit, I wanted to drive from Orlando to Mobile so I could see my soon-to-be wife. I borrowed my buddy's car and was absolutely shocked gas prices were above $2.75.
Those were the days, weren't they?
We ended up siphoning gas out of my dad's 1968 Mustang so I could make it back down to Orlando!
Now, notice how the difference between front-month and next-month was relatively stable when oil started to run hard.
It wasn't until crude’s parabolic move in 2007 that we saw a massive difference — known as backwardation — which led to a crash.
And this most recent oil spike?
The strongest backwardation we've seen.
That’s telling me yes, oil had a huge spike…
And the current geopolitical mess can change things.
Yet for now, it looks like this spike is it.
That said — if you’re looking for continued upside in crude, watch how the curve starts to behave.
If the front month is rallying and you see the rest of the curve stay bid as well, you've got sticky prices that could be a problem over the medium-term for the economy.
Semi-related:
If you want to learn an excellent investing strategy for weathering economic storms like the one we’re in…
One that lets you almost “predict” mergers/acquisitions, new product launches, strong earnings, successful drug trials at biotech firms, and other stock-boosting events…