LIMITED TIME OFFER - 10% off our service! Use promo code "IE10OFF" to save up to $200. Learn more or contact us here.
How you view this market depends on which part of it you've focused on.
Yes, the selloff in the Nasdaq 100 has been bad, but it's like watching one of those videos where you see a pile-up on an icy road...
Most of the damage has already happened, but another car comes down the street. You know their brakes won’t work, so they'll slide right into that bus.
That said: It's been an absolute bloodbath in high-growth land. They are selling anything that isn't nailed down, and individual companies are being completely obliterated on their earnings.
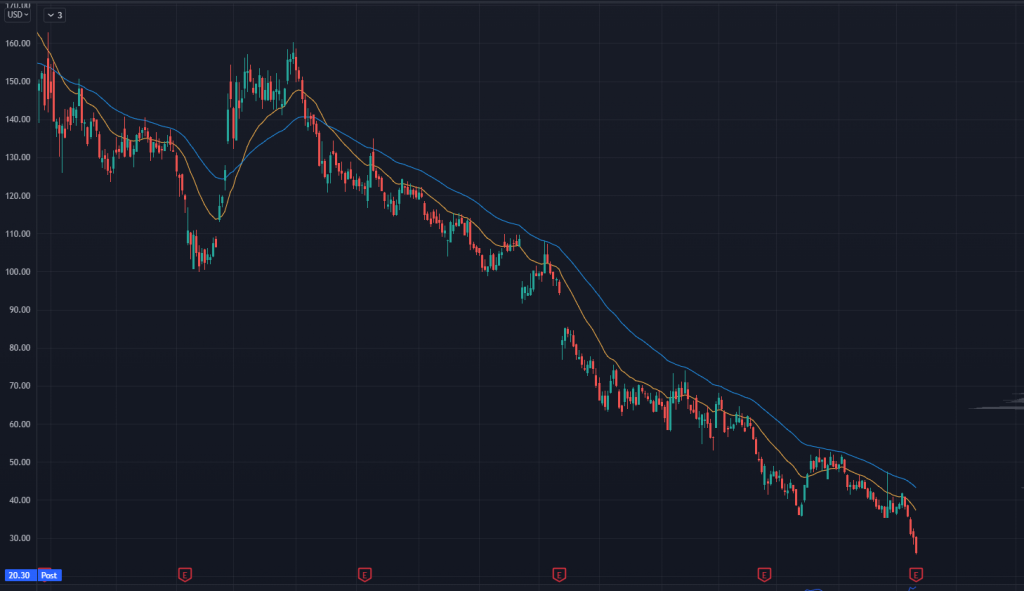
Beyond Meats (BYND) was at $150 last summer. It has since traded down to $26 and is now sitting at $20 aftermarket.
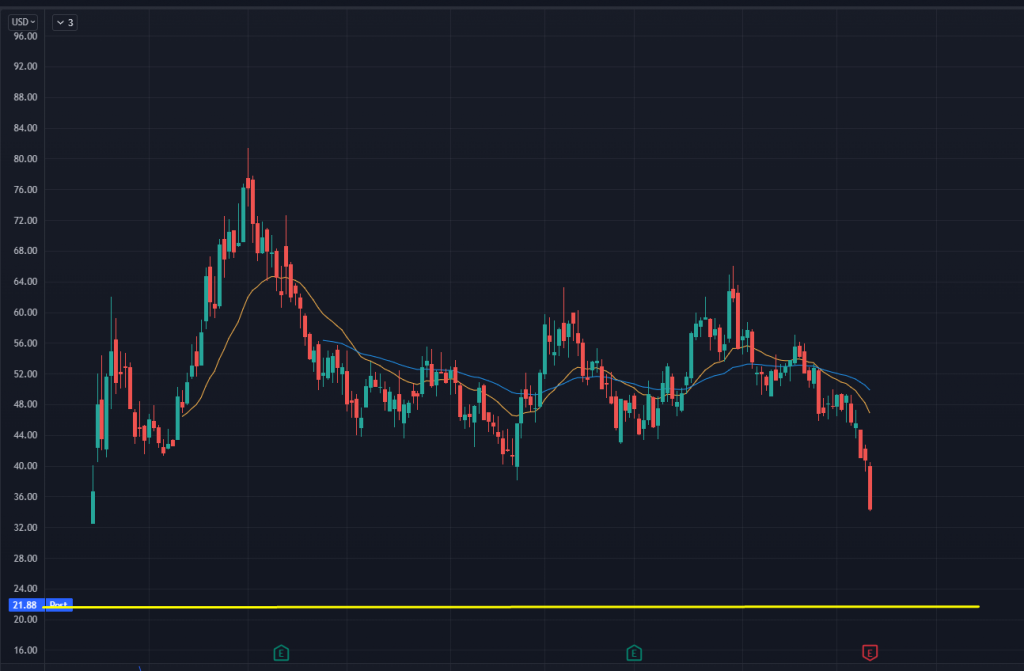
Dutch Bros (BROS), after having a nice run to 80 bucks, ran back all the way to $34.
Oh yeah, and they had earnings. The stock is down an additional 38% on earnings.
Although many of these names had been at absurdly high valuations, there have to be some quality companies currently offered at amazing prices.
But how do we know which ones to take?
If you want to try your luck, here are two fundamental metrics to watch.
Many of these high-growth companies will operate at a loss as they grow, scale, and either
A better metric would be to look at a company’s value relative to its total sales in a year, or Price/Sales (P/S for short).
Here's a look at the P/S for UPST, a company that’s been taken to the woodshed recently:
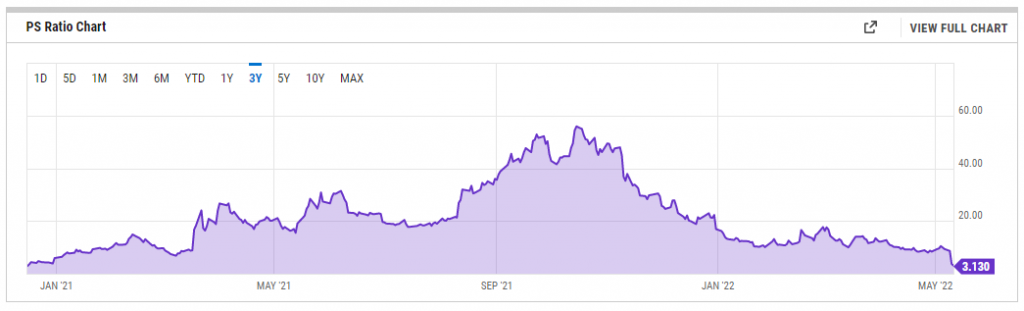
After peaking at a P/S ratio of 56, P/S has fallen all the way down to 3.7.
The ratio just drastically changed because the company reported earnings with better sales, and then the stock crashed from $77 to $30.
Now, it's possible the company becomes unable to finance its growth anymore, making it a potential valuation trap.
There's another way to look for good investments, especially in this market.
This metric looks at a company’s enterprise value relative to the cash flow it can generate.
Growth companies get punished in a rising interest rate environment if they can't create enough cash to fund operations.
Some of these names can drop enough to where interest rate risk isn't as big a deal for the company.
Back in late 2017, the entire market was ripping higher, but General Electric (GE) was in a steady downtrend.
The dividend yield rose to a point where I thought it was a pretty good buy…
So I looked to sell puts and get assigned, then collect the dividend as it was a great value.
Guess what the stock did after that:
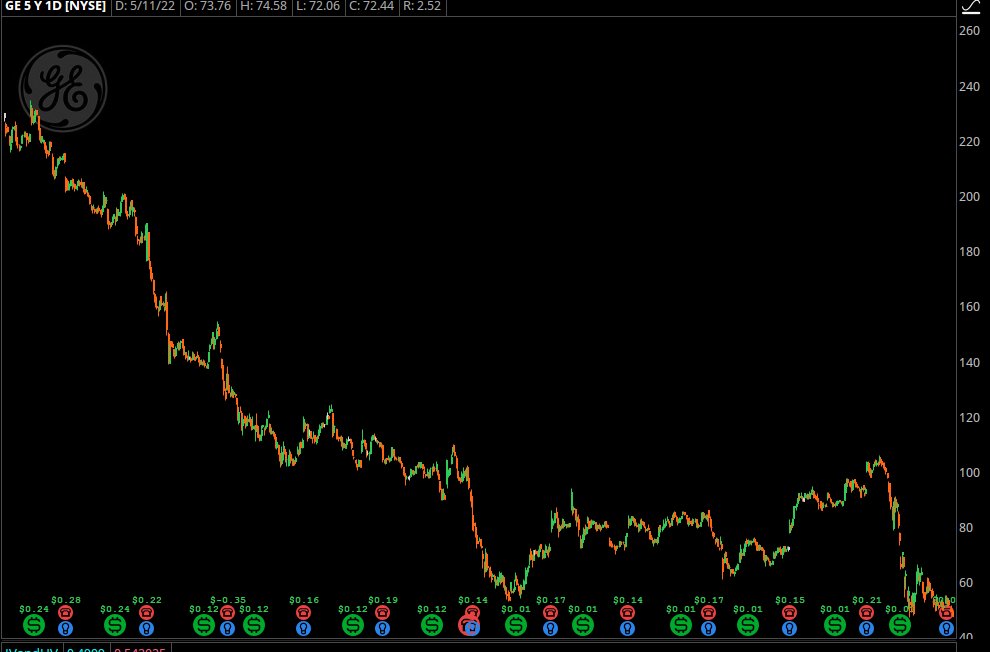
It sold off even further... and then they cut their dividend to a penny.
Even if you score the buy of the century…
It won't matter if you have a ton of trapped money that you need to get out at any price.
That's why it may be a better idea to focus on the names that are the "first out.” The ones that have been so strong relative to the market, making them the fastest movers.
Click HERE to learn a nifty way to find these “first-out” names.